Determining the moving averages of large data sets can be a mind-boggling and frustrating experience if done manually. Fortunately, thanks to Microsoft Excel, calculating these averages has never been easier. With its intuitive functions and fail-proof accuracy, Excel can compute moving averages for anything from stocks to research data.
Before explaining how to use this incredibly helpful function, it is important to understand exactly what a “moving average” is. Essentially, moving averages are the means (averages) of multiple subsets grouped together within a larger data set. This type of average is described as “moving” because as new groups of data are added to the data set, the average is recomputed (and therefore constantly fluctuating).
- How to lock cells in Excel
- How to make a check mark in Excel
- How to add additional rows above or below in Excel
- How to use VLOOKUP in Excel
The most common application of moving averages is in the technical analysis of stock prices. Using this value, a stockbroker can determine the average price of a stock at any given point. This helps to reduce any surprises caused by the sporadic changes often present in the stock market.
Determining the moving average of a data set with Excel
1. First, click Microsoft Excel’s Data tab. The Data tab offers different options to manipulate, analyze or visualize data.

2. Under the Analysis section, click on Data Analysis. This action will open a window that lists the different analysis functions that can be performed.

3. From the above list, select Moving Average and click Ok. The Moving Average window should appear.

4. Enter the data range on the Input Range field. Next, enter the range where the moving averages will be listed on the Output Range field.

5. Input the preferred Interval, or the number of values included per subset.

6. You can also ask Excel to visualize your data using a graph by ticking the Chart Output checkbox.

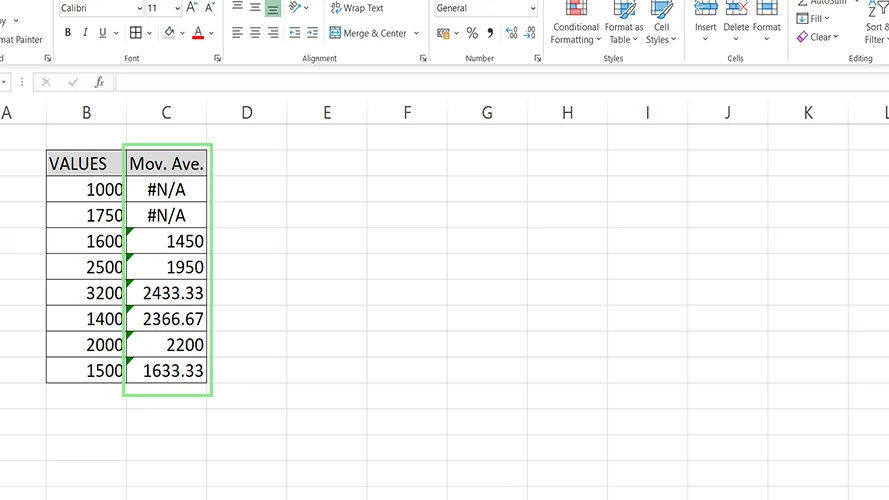
7. Lastly, click the Ok button. The moving averages of the data should now be visible on the Output Range. Some #N/A errors may appear for subsets with insufficient data to complete the selected intervals.